Spatial proteomics pipeline for precision oncology
Umbizo built a computational pipeline for a precision oncology centre that processes 60-marker spatial proteomics data from Akoya PhenoCycler IO60 panels, turning tumour microenvironment imaging into clinical scoring metrics to support treatment decisions.
The challenge
Traditional bulk analysis could not capture the spatial complexity of tumour microenvironments, limiting its clinical usefulness. The Akoya PhenoCycler IO60 provides 60-marker spatial resolution but needed robust infrastructure to yield clinical guidance. The work had three parts: handling Akoya's evolving qptiff file format, automating batch processing for clinical-scale throughput, and developing validated scoring algorithms for oncology treatment decisions.
What we set out to do
- Build a complete upstream pipeline from qptiff input to quantification
- Create eight clinically actionable scoring metrics for treatment guidance
- Process upstream components in under 2 hours
- Implement automated batch processing with parallel execution
- Validate scoring algorithms against known immunological states
- Handle more than 50 samples per week for clinical deployment
- Provide quantitative foundations for immunotherapy selection and combination strategies
Our approach
Data architecture analysis
Assessed Akoya's multi-layer qptiff format (holding 60-marker PhenoCycler data, H&E staining, original photography, and slide barcoding), developed an extraction method to isolate clinically relevant imaging components, used the Bio-Formats suite to convert qptiff to OME-TIFF, and configured the MCMICRO pipeline for IO60 specifications.
Validation framework
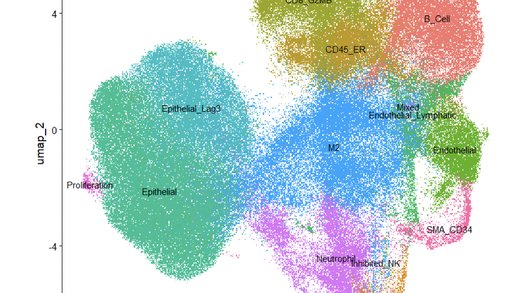
Set up a framework comparing LAG-3 high and LAG-3 low tumour populations, representing immunosuppressive versus standard tumour microenvironments, to validate the scoring algorithms.
Technical implementation
Integrated QuPath for format conversion with compression and validation protocols, configured the MCMICRO Nextflow pipeline for segmentation and quantification, selected Seurat as the spatial analysis platform, and built a tiling approach with user-adjustable parameters for different tissue architectures.
Clinical scoring and automation
Constructed eight clinical scoring algorithms covering immune activity, therapy targets, tumour growth, immune evasion, delivery barriers, treatment complexity, target accessibility, and microenvironment classification; integrated a SLURM scheduler for parallel processing across compute nodes; and added automated quality control that flags regions with compromised segmentation.
Solution delivery
Delivered an upstream pipeline with automated error handling, five fully validated clinical scoring algorithms with demonstrated discriminatory power, automated marker positivity detection using False Discovery Rate statistics, GitHub-published code with documentation, training materials, and the full pipeline packaged in Docker for transfer.
Results and impact
Upstream processing took 1.5 hours, beating the 2-hour target, with the complete pipeline taking 3-4 hours per sample of roughly 216,000 cells. Parallel execution through SLURM supports 48+ samples per day, and system reliability exceeds 99% with a failure rate under 1%. Five scoring algorithms successfully distinguished LAG-3 high (immunosuppressive) from LAG-3 low (standard tumour) conditions, converting spatial proteomics data into quantitative clinical decision-support metrics.
“This pipeline is a significant advance for our precision oncology work. It turns our 60-marker PhenoCycler data into insights that genuinely inform treatment decisions.”
Timeline
- Upstream pipeline development and Bio-Formats integration: 2 weeks
- MCMICRO configuration and optimisation: 1 week
- Downstream analysis framework and Seurat implementation: 2 weeks
- Clinical scoring algorithm development: 3 weeks
- Validation and quality assurance testing: 2 weeks
- Documentation and training materials: 1 week
- Total: 11 weeks
Looking forward
Adding sub-cellular segmentation to MCMICRO once available (which would enable the target accessibility score), and exploring machine learning for predictive modelling and automated pattern recognition on the spatial data.